Watt-Seer - Personalized Energy Coach
This is the blog for Gen AI Intensive Course Capstone 2025Q1 Project which is part of 5-Day Gen AI Intensive Course with Google
👥 Team Members
🔍 The Problem: Understanding Home Energy Use
Most people don’t understand what’s driving their energy bills. Even when they have access to hourly or daily usage, it’s just rows of numbers.
On the other hand, millions of Americans only have paper bills with monthly totals, and no tools to compare or analyze.
Gen AI, especially multimodal models like Gemini, can bridge this gap — turning structured data and unstructured images into meaning.
📖 Want to learn more?
Please read our Medium blog that deep dives into the problem, the GenAI approach, and its capabilities in solving this challenge — with a special focus on the Watt-Seer use case.
And now a storytelling case study on using Kaggle + Gemini to compare home energy data and extract insights from scanned bills.
🔋 Watt-Seer - Personalized Energy Coach Use Case: How Three Neighbors Used AI to Understand Their Energy Usage
In a quiet cul-de-sac in Portland, three retired neighbors found themselves in a uniquely 21st-century situation: they wanted to understand their electric bills — and only one of them knew how to code.
👨🔧 The Engineer and the Salesman
Ed, a retired electrical engineer, is the neighborhood’s unofficial handyman. His garage is filled with sensors, solar panels, and spreadsheets. One day in January, he noticed his electricity bill had doubled. His reaction?
“I downloaded my entire year’s hourly usage data from Portland General Electric and wrote a script to find the peak days.”
Jerry, the neighbor across the street, used to be a salesman. He’s old-school — keeps all his electric bills in a manila folder. When he heard Ed talking about kilowatt-hours and usage curves, he just shook his head.
“I’ve got the bill right here,” he said, waving a paper copy. “But what does it all mean?”
🤖 Enter Anita: The AI Neighbor
Anita, the third neighbor, had just left her role running a boutique AI consultancy. She overheard the discussion on one of her dog walks.
“You know,” she smiled, “you two are sitting on a goldmine of data. Want help turning it into something useful?”
Together, they launched a weekend project to build something simple, visual, and smart: Watt-Seer — an AI-powered notebook that turns raw energy data and scanned bills into personalized energy insights.
🛠️ What They Built: Watt-Seer Personalization Coach
- Ed provided the hourly energy consumption data from his utility.
- Jerry gave Anita a photo of his electric bill.
- Anita spun up a Kaggle notebook, loaded Pandas, and brought in Gemini.
The Result:
✅ Monthly summaries from Ed’s data
✅ Extraction of key details (kWh, dates, cost) from Jerry’s scanned bill
✅ AI-generated comparisons and suggestions for energy-saving actions
Check out the Video

📉 Ed’s Consumption on a Cold Week
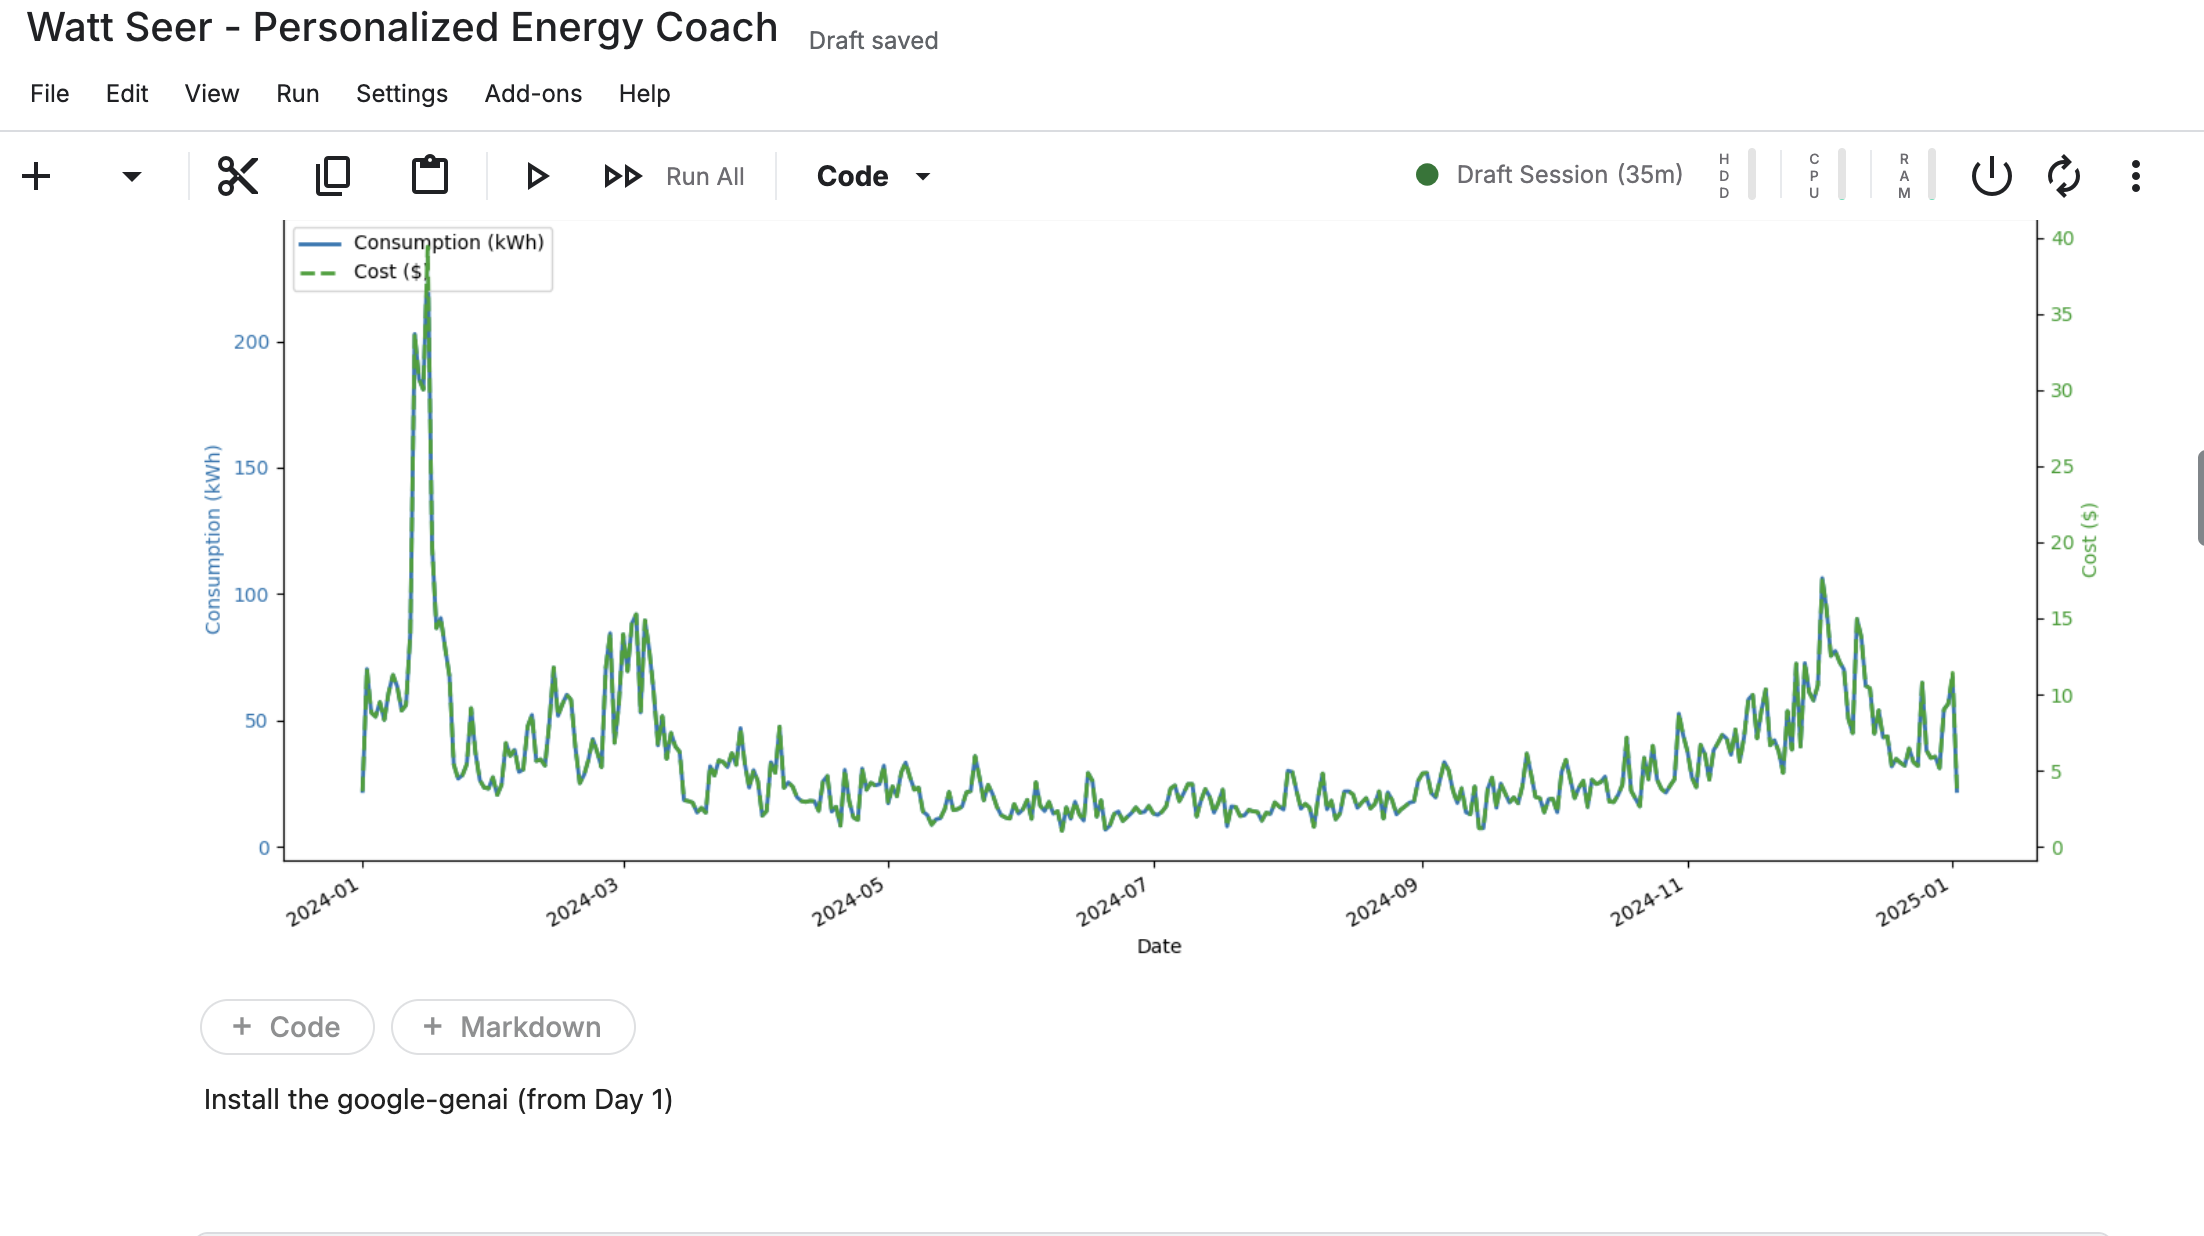
“You used 237 kWh on January 16 alone,” Anita pointed out. “AI root caused it and it Looks like your heat pump switched to resistance mode during the cold snap.” Here’s what AI figured out.
❄️ How Temperature Explains High Energy Usage
“You used 237 kWh on January 16 alone,” Anita pointed out.
“AI root caused it and it looks like your heat pump switched to resistance mode during the cold snap.”
Here’s what AI figured out:
- Sustained Deep Freeze
The most crucial factor is the consistently low temperatures from Jan 13th to 16th.- Average daily temperatures ranged from 12.4°F to 15.5°F
- Minimums dropped into single digits (6.6°F) and low teens
- Maximum temperatures rarely exceeded 32°F (freezing) during this stretch
- Constant Heating Demand
When outside temperatures are extremely low:- Homes lose heat rapidly to the environment
- Heating systems must run almost continuously to maintain indoor comfort
- The colder it is, the faster the heat loss and higher the energy consumption
- Auxiliary/Emergency Heat Activation (Likely Culprit)
Most heat pumps have a secondary heating source — electric resistance heat strips — for very cold conditions.- Heat pumps become inefficient below ~20–30°F, depending on the model
- When the thermostat calls for a rapid temp increase or hits the efficiency threshold, the system activates auxiliary heat
- Electric resistance heat is highly energy-intensive (like running a giant toaster!)
- The spike to over 200 kWh on Jan 16th strongly indicates prolonged use of electric resistance heating
- Cumulative Effect
After several days of freezing temperatures (Jan 13–15):- The thermal mass of your home (walls, floors, furniture) cools down significantly
- More energy is required to reheat the space, resulting in a massive load on Jan 16th
- Jan 17th Comparison
- Usage dropped to 119 kWh — still high, but notably lower
- This aligns with warmer temperatures:
- Average: 29.6°F
- Max: 44.5°F
- Heating systems likely ran less frequently
- The need for auxiliary heat was reduced or eliminated
🧾 Jerry’s Bill, Extracted by AI
Gemini Vision read Jerry’s scanned bill and returned:
- Billing period: Jan 5 to Feb 5
- Usage: 3,200 kWh
- Cost: $528
- Estimated rate: $0.165/kWh
💬 Gemini-Powered Recommendations
” Ed’s electric resistance heating likely caused the winter spike. Consider supplemental heating or sealing air leaks.”
Gen AI Capabilities
Anita tells Ed and Jerry that she used a number of Gen AI capabilities such as Document Understanding, Few Shot Prompting, Evaluation, and Image Understanding while building this Kaggle Notebook.
🧪 Sample Code from the Watt-Seer Notebook
🔹 Resampling hourly data to monthly
df['start_time'] = pd.to_datetime(df['start_time'], utc=True)
df = df.set_index('start_time')

monthly_data = df.resample('M').agg({
    'consumption': 'sum',
    'provided_cost': 'sum'
}).round(2)
🔹 Formatting for Gemini comparison
compare_prompt = f"""
Here is my neighbor’s extracted monthly energy usage:

{neighbor_usage_summary}

Here is my own energy usage during the same months:

{monthly_text}

Please compare our energy usage and suggest why there might be differences. We both are in Portland, OR and are a two person household. Use a simple ratio of my usage/neighbors. Also mention whether the usage levels are typical for similar homes.
"""

response_compare = client.models.generate_content(
    model='gemini-2.0-flash',
    contents=compare_prompt
)

Markdown(response_compare.text)
🔹 Sending a bill image to Gemini
prompt = [
  f"This is my neighbor’s electric bill. Please extract the monthly energy usage (in kWh) for all the months",
  PIL.Image.open("/kaggle/input/neighborbill/Neighbor-Bill.jpeg")
]

response = client.models.generate_content(
    model='gemini-2.0-flash',
    contents=prompt
)
neighbors_energy = response.text
Markdown(response.text)
🚧 Limitations & What’s Next
- 📷 Image extraction isn’t perfect: Gemini misread handwritten notes or low-res scans.
- 💬 AI-generated insights may need validation: Always double-check suggestions with a professional (especially for HVAC or insulation upgrades).
- 🔮 Future Possibility: Automatically pull utility data through API, integrate other energy data (eg solar) and include smart thermostat data to tell the house temperature, or use fine-tuned models for your home’s energy profile.
🤝 From Personal Curiosity to Community Action
By combining code, AI, and community, Ed, Jerry, and Anita turned a conversation into insight.
If you’ve got a folder of bills — or a zip of usage data — maybe it’s your turn next.
🧠 Acknowlegements
- We collaborated in 4 seperate projects with Zoom calls, discord, and Kaggle Group shared notebook. We would like to acknowledge all the other team members in those projects: Arushi, Eric, Lan, Harshita, Praveen, Naga, Jim, Lamide, Saad, Jonathan. Special thanks to Arushi Tariyal for going above and beyond helping us and others as well.
🔗 How you can take Action
🔗 View on Kaggle
🔗 Join the Solvers Collaborative Substack
Upload your own usage data. Or just bring a photo of your bill.
Let the AI do the explaining.
You’ve got energy stories waiting to be told.
| Questions/Feedback? Post your questions via Kaggle Comments | or open an issue on our |